
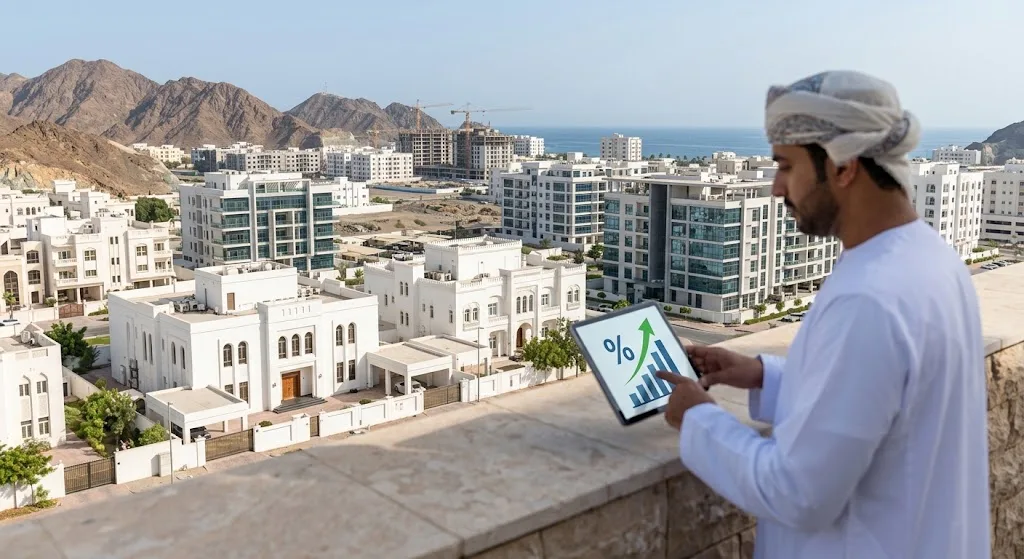
Oman's National Centre for Statistics and Information (NCSI) published its Q1 2026 Real Estate Price Index in June, and the headline number is hard to miss: prices up 15.9% year-on-year nationally. That's a big enough move to make investors ask what's actually driving it — and, just as importantly, whether it means anything for a specific neighborhood versus the country as a whole. Here's what the official numbers actually break down to — or see the data laid out directly against our tracked areas in the full quarterly market report.
The headline number, broken down#
NCSI's index splits real estate into residential and commercial categories, each further broken into land, built units, and other sub-categories. The residential side moved faster than commercial:
| Category | Q1 2026 vs. Q1 2025 |
|---|---|
| Overall index | +15.9% |
| Residential (all) | +17.6% |
| — Residential land | +21.0% |
| — Villas | +9.0% |
| — Apartments | +4.4% |
| — Other houses | −1.1% |
| Commercial (all) | +10.5% |
| — Industrial land | +16.5% |
| — Commercial land | +11.0% |
| — Retail shops | −1.8% |
The pattern is consistent with what's visible on the ground in Muscat's freehold areas: land is appreciating faster than finished units. That tracks with a market where buildable, serviced land near approved developments is the scarcer input, while completed apartment stock — closer to a commodity once it's built — moves more slowly. It's also a caution against reading "real estate prices up 15.9%" as "the villa I'm looking at is worth 15.9% more than a year ago" — villas specifically rose 9%, and apartments just 4.4%, both well under the headline figure.
Muscat pulled far ahead of every other governorate#
The governorate-level breakdown for residential land prices is the most striking part of the release, and the spread is wide:
| Governorate | Residential land, YoY |
|---|---|
| Muscat | +43.6% |
| Al Buraimi | +25.9% |
| Musandam | +17.6% |
| Dhofar | +10.8% |
| Al Dakhiliyah | +5.0% |
| South Al Sharqiyah | +4.7% |
| South Al Batinah | +4.0% |
| Al Dhahirah | +2.5% |
| Al Wusta | +2.0% |
| North Al Batinah | +0.2% |
| North Al Sharqiyah | −14.9% |
Muscat's residential land prices rose nearly 2.5 times faster than the second-placed governorate, Al Buraimi. NCSI's release doesn't state a cause for any individual governorate's move — only the size of it — so treat the "why" as informed context rather than an official explanation: Muscat is where the bulk of Vision 2040-linked infrastructure spending, ITC development (Muscat Bay, Al Mouj, Muscat Hills), and Sultan Haitham City construction activity is concentrated, all of which plausibly compete for the same limited pool of serviced, buildable land close to the capital. Dhofar's +10.8% is also worth noting given Salalah's growing freehold footprint around Hawana Salalah — see our Salalah area coverage for the neighborhood-level numbers behind that governorate figure.
The one governorate that actually declined — North Al Sharqiyah, down 14.9% — is a reminder that "Oman real estate" isn't one market moving in one direction. It's several regional markets, some overheating and some cooling, compressed into a single national number by the time it reaches a headline.
Transaction activity: steady sales, faster-growing mortgages#
Alongside the price index, NCSI's transaction data for January–May 2026 (reported via the Oman News Agency) shows a market where activity is holding up, even as prices rise:
- Total transacted value: RO 1.18 billion, up 5.5% from RO 1.11 billion in the same period of 2025
- Property sales value: RO 551.8 million, up 2.9%, across 27,864 sales contracts (up 2.1% from 27,302)
- Mortgage contracts: value up 7.9%, with contract count rising from 9,140 to 11,130 — a noticeably faster pace than sales contract growth
- Title deeds issued: down 12.9% overall, including a 28% drop in title deeds issued specifically to GCC citizens
That last figure is the one that doesn't fit a simple "everything is up" story. Sales contracts and mortgage activity both grew, but the number of title deeds actually issued fell — and fell faster for GCC-citizen buyers than the market overall. NCSI's release doesn't explain the gap, and it's not a pattern this site can responsibly speculate on further with the data currently available; it's flagged here because a serious buyer or investor should notice a divergence like that, not because we have a confirmed explanation for it.
What this means if you're comparing areas right now#
A national index rising 15.9% is a useful signal that Oman's property market has real momentum behind it in 2026 — but it's not a substitute for area-level data when you're actually deciding where to put capital. Two practical takeaways:
- Muscat's outsized land-price growth is consistent with, not separate from, what we're tracking area-by-area. If you're comparing specific neighborhoods, start with our area comparison tool rather than applying the national or governorate figure directly to a property you're evaluating.
- Rising prices don't automatically mean rising yield. Price appreciation and rental yield move independently — a fast-appreciating area can still carry a lower gross yield than a slower-appreciating one, depending on rents. Run the numbers for a specific area with our yield calculator before treating "prices are up" as "this is a good investment."
As always, every figure in this article is dated and sourced to NCSI's official release and the Oman News Agency's reporting on it — see our data & methodology page for how this compares to the listing-based estimates used elsewhere on this site.
Sources: National Centre for Statistics and Information (NCSI) Q1 2026 Real Estate Price Index, released mid-June 2026; NCSI transaction and mortgage data for January–May 2026.