
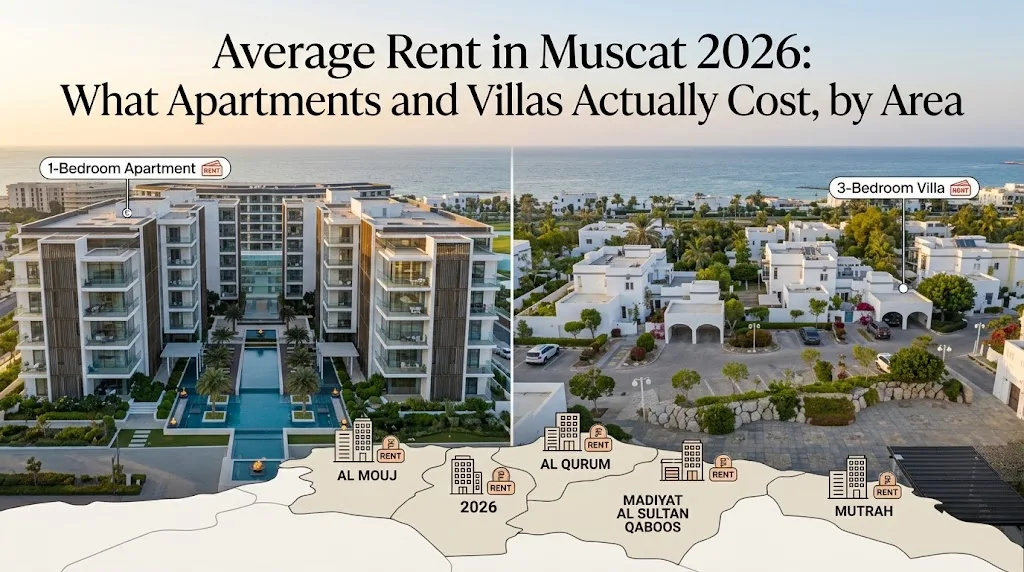
Search for "average rent in Muscat" and you'll get a single number. That number is close to useless on its own, because the spread behind it is enormous: a two-bedroom apartment in this city rents anywhere from OMR 300 to OMR 710, and which end you land on is decided by neighbourhood, not by the apartment.
Here are the citywide figures, and then the part that actually helps — the area-level breakdown, laid against the price-per-sqft data we track for the same neighbourhoods.
Citywide averages, June 2026#
| Unit type | Average | Range |
|---|---|---|
| Studio | OMR 210 / month | OMR 150–280 |
| 1-bedroom | OMR 290 / month | OMR 180–450 |
| 2-bedroom | OMR 430 / month | OMR 300–710 |
| Per square metre | OMR 5 | OMR 3.5–10 |
Source: our Muscat rent analysis, updated July 2026, built from aggregated market data cross-checked against live listings. We deliberately do not treat asking prices alone as the city average, which matters, since asking rents in Oman typically sit above achieved rents.
What that looks like by area#
Rent tracks the same geography as sale prices, which is the useful part: the areas commanding the highest rent are the same ones carrying the highest price per square foot, and the mid-market areas that look unglamorous are where the yields actually are.
| Area | Typical 2BR rent | Tracked price/sqft | Est. gross yield |
|---|---|---|---|
| Al Mouj | ~OMR 710 | OMR 140 | 5.2% |
| Muscat Hills | ~OMR 490 | OMR 110 | 6.2% |
| Qurum | OMR 350–500 | OMR 98 | 6.0% |
| Madinat Sultan Qaboos | Mid-range, family-driven | OMR 100 | 5.5% |
| Azaiba | Mid-market, corporate demand | OMR 81 | 6.0% |
| Al Khuwair | OMR 220–475 | OMR 81 | 7.5% |
| Al Ghubrah | Mid-market | OMR 71 | 7.0% |
| Al Khoud | Budget end | OMR 60 | 7.5% |
Price and yield figures are the ones published on each area page on this site — our own dataset, normalised and adjusted for the typical asking-to-achieved gap. See our methodology for exactly how.
The pattern is worth stating plainly, because it runs opposite to how these areas are usually marketed:
The most desirable places to live are the worst places to buy for yield. Al Mouj rents higher than anywhere else in Muscat and yields the least, at an estimated 5.2%, because its sale prices have run further ahead of its rents than anywhere else in the city. Al Khuwair, with none of the waterfront appeal, yields an estimated 7.5% on a price per square foot 42% lower.
That isn't an argument against Al Mouj — it is a genuinely different product, freehold-eligible for foreign buyers, with a resale market that exists precisely because of the lifestyle premium. It's an argument against reading "premium area" as "better investment," which is how most listing sites present it.
Where the tenant demand actually comes from#
Rental demand in Muscat isn't uniform, and knowing which pool a given area draws from tells you more about void risk than the headline rent does:
- Al Khuwair draws from the ministries and offices clustered around it. Dense, reliable tenant pool, with frequent turnover — you re-let often, but you re-let quickly.
- Muscat Hills and Azaiba draw heavily on corporate housing, helped by airport proximity. Company-paid leases, longer terms, tenant quality set by the employer.
- Al Mouj and Qurum draw from senior expat professionals and families, with schools and beach access driving the decision. Longer stays, higher rents, fewer prospective tenants at any given moment.
- Madinat Sultan Qaboos is a family district first — international schools and supermarket infrastructure are what the rent buys.
- Al Khoud and the Seeb corridor are cost-driven, with student and entry-level demand from the university area.
The rent numbers that don't apply to you if you're buying#
One structural point that catches foreign investors: as a non-Omani, you can only buy inside a designated Integrated Tourism Complex. That rules out most of the areas in the table above as purchase targets, even though you can rent in any of them.
The freehold-eligible communities in Muscat are Al Mouj, Muscat Hills, Muscat Bay, Jebel Sifah and AIDA at Yiti — the top of the price table and the bottom of the yield table. The 7.5% yields in Al Khuwair and Al Khoud are real, and they are not available to a foreign buyer. Our expat freehold and ITC guide covers exactly which zones qualify and how to verify a development's licensing.
How rents are actually paid here#
Three practical conventions that differ from most Western markets:
- Advance payment is normal. Rent is quoted monthly, but landlords commonly ask for several months or a full year up front, plus a deposit. Longer advance payment is frequently negotiable against a lower monthly rate.
- Tenancy contracts are registered with the municipality, and a 3% municipal tax on rent applies.
- Furnished vs. unfurnished changes the number materially, more so than in markets with deeper rental stock. Confirm which the quoted rent refers to before comparing two listings.
Is rent going up?#
Oman's official NCSI Real Estate Price Index rose 15.9% year-on-year in Q1 2026 — a number that gets quoted constantly, usually with the implication that rents are climbing at that rate. They are not. That index measures sale prices, it's dominated by land transactions, and within its own residential breakdown, apartments rose just 4.4% while residential land rose 21%.
Land speculation running ahead of built-unit prices is a different phenomenon from rental inflation. We break the release down properly in our Q1 2026 price index analysis and our quarterly market report.
Turning a rent figure into a yield#
If you're looking at these rents as an investor rather than a tenant, the number that matters is what the rent returns against total acquisition cost — including Oman's ~3% registration fee, agency commission on a resale, and annual service charges in an ITC community, which are not trivial in the waterfront developments.
Our yield calculator runs that properly, and the AI Property Advisor will match a budget against the same tracked area data used in the table above.
Sources: our Muscat rent analysis (updated July 2026); NCSI Real Estate Price Index Q1 2026; price-per-sqft and yield figures from our own area dataset, per our stated methodology.